ETS-PC Calibration Scenarios
Professor Frank Schieber, Heimstra Human Factors Laboratories, University
of South Dakota
Scenario #1
Monitoring Fixation Patterns on a Computer Display
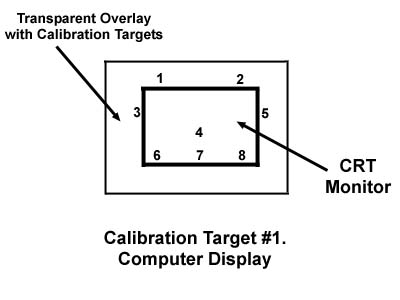
We initially set-up the ETS-PC eye tracker on a laboratory bench and spent much of the Spring 2002 semester learning how to use the system. Our first attempts to use the ETS-PC involved tracking eye gaze locations while an observer worked with a computer display. For calibration purposes, we constructed a plexiglass panel that contained 8 calibration targets (small blue circles numbered 1 through 8). This transparent panel was aligned in front of the test display monitor during the calibration phase prior to eye tracking (see the diagram presented below).
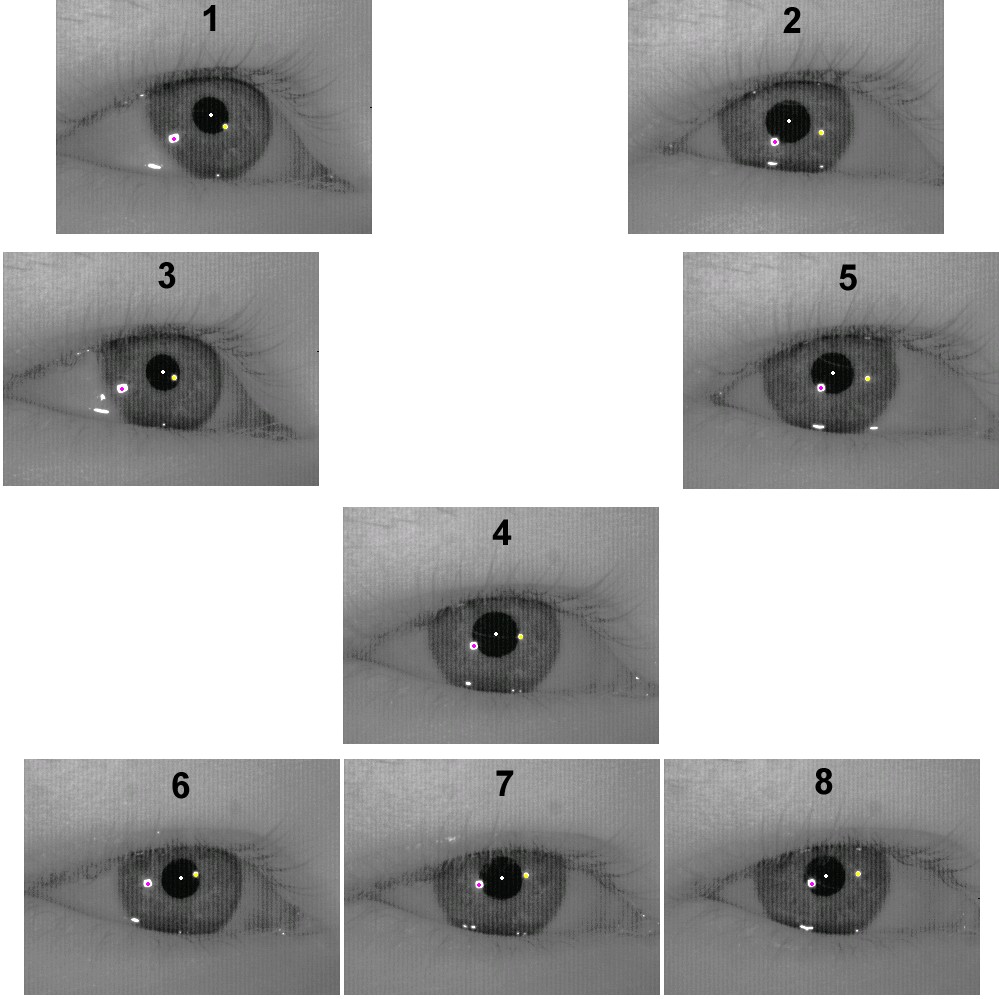
During the calibration procedure the observer is required to fixate each target when prompted by the experimenter. For diagnostic and demonstration purposes, the ASL ETS-PC software stores a "snap shot" from the eye camera for each target sampled during the calibration process. The following figure depicts the eye camera's view of a typical observer's right eye as he moved his gaze to each of the 8 fixation targets. Notice how the corneal reflections of the 2 IR illuminators systematically vary in spatial position relative to the center of the pupil while the observer moves his eyes to fixate each of the aforementioned calibration targets. The ASL ETS-PC computes the location of the pupil center followed by the relative positions of the corneal reflections as uses this data to compute eye gaze location.
Scenario #2.
Monitoring Eye Movements while Reading Highway Signs
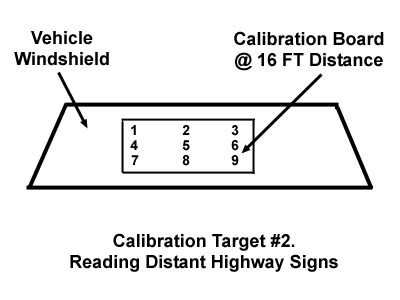
Once the ASL ETS-PC was mounted in our instrumented research vehicle, we began to work on various procedures to calibrate the system for actual on-the-road research protocols. One of our first scenarios involved calibrating the system for a nighttime highway sign reading study. Our calibration stimulus consisted of a 4 x 8-ft sheet of plywood that was painted black. Nine 4 x 4-inch retroreflective targets were arranged in a 3 x 3 matrix (as depicted in the figure below). Each of the targets contained a 3-inch tall black (non-reflective) numeral (1 through 9 across the array). The vertical columns of the fixation target array were spaced 24-inches apart while the horizontal columns were spaced approximately 14-inches apart. The fixation panel was viewed at a distance of 16-feet and was elevated to subtend the driver's central field-of-view.
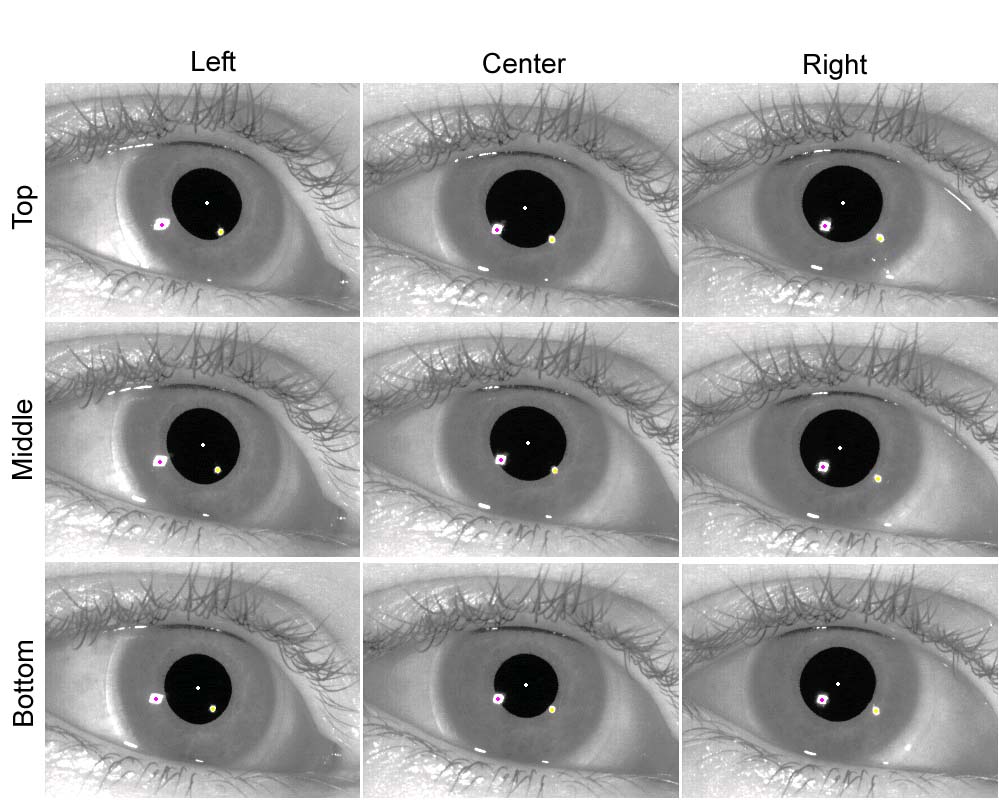
Eye camera views of the driver's right eye while fixating each of the 9 fixation targets are depicted below. Compared to the first scenario presented above, the relative displacements of the corneal reflections are somewhat smaller. This is due to the fact that the total angular displacement of the array of fixation targets is significantly reduced in scenario #2. Nonetheless, the ETS-PC performed very well when this particular driver's sign reading behavior was analyzed.
USD Home Page - Professor Schieber's Home Page - Previous Page